Debugging an Analysis
Hopefully you got through the last section without encountering any errors in your analysis. In this section, we’ll explore how to debug an analysis. First, we’ll walk through a common scenario where required user input is missing. Then, we’ll switch to the developer view to troubleshoot analysis-specific errors.
We will start with the common scenario in which an error message is
presented due to a user’s lack of inputs. Start by removing both
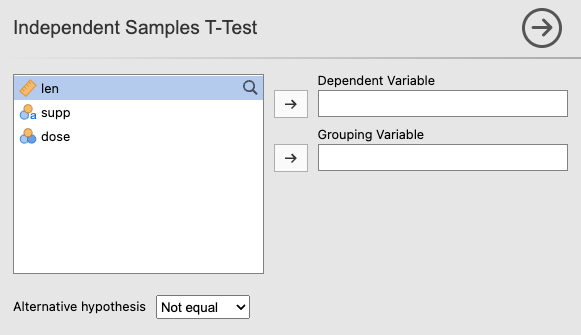
len from the Dependent Variable and also
remove supp from the Grouping Variable. The
variables should be removed from these sections and look like this:
Now, you will see an error message where the output previously appeared:
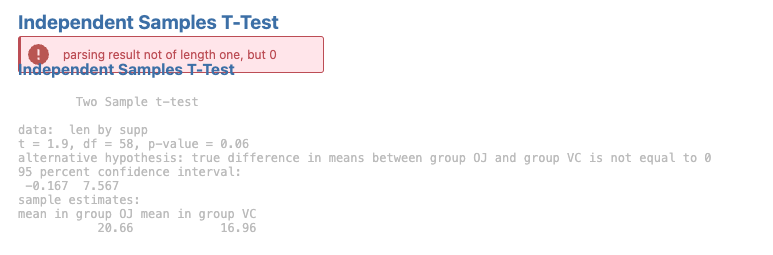
This error message tells us that the data passed through has a length
of 0 because the user hasn’t selected any variables yet. It’s best
practice to avoid showing user-error messages in these initial steps
when the issue isn’t true user error, but simply missing required
inputs. To prevent this, we’re going to add a short guard clause to our
ttest.b.R file:
          if (length(self$options$dep) == 0 || length(self$options$group) == 0) {
              return()
          }
The full script for ‘ttest.b.R’ file should currently look like this:
ttestClass <- if (requireNamespace('jmvcore', quietly=TRUE)) R6::R6Class(
    "ttestClass",
    inherit = ttestBase,
    private = list(
        .run = function() {

            if (length(self$options$dep) == 0 || length(self$options$group) == 0) {
                return()
            }

            formula <- jmvcore::constructFormula(self$options$dep, self$options$group)
            formula <- as.formula(formula)

            results <- t.test(formula, self$data, var.equal=self$options$varEq)

            self$results$text$setContent(results)
        })
)
So now, if the user hasn’t selected both a
Dependent Variable and a Grouping Variable,
the analysis will exit early without attempting to run the t-test. This
prevents jamovi from displaying an error message while the analysis is
still in its initial (incomplete) setup state.
For this next step we are going to show how to debug an analysis that
has gone wrong using the dev mode. Lets change our .run()
function in the ttest.b.R to produce an error:
ttestClass <- if (requireNamespace('jmvcore', quietly=TRUE)) R6::R6Class(
"ttestClass",
inherit = ttestBase,
private = list(
.run = function() {
t.test(c(Inf, 3)) # <-- produces an error!
})
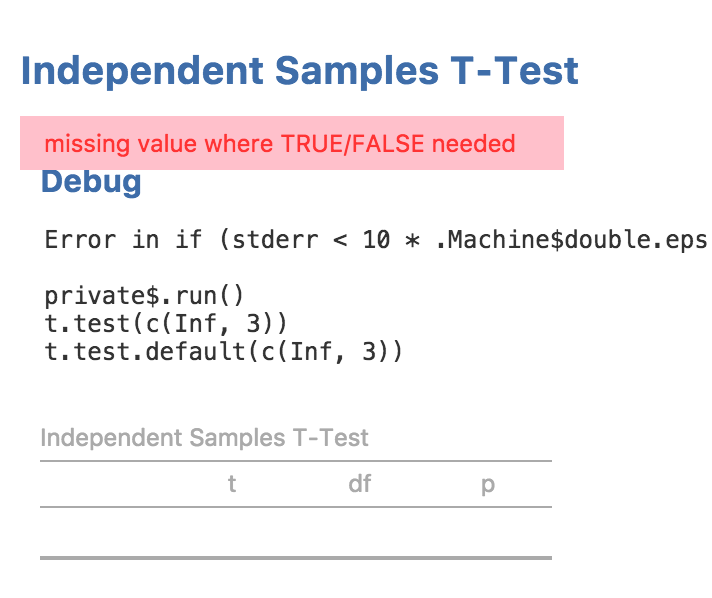
)We receive the following error message.
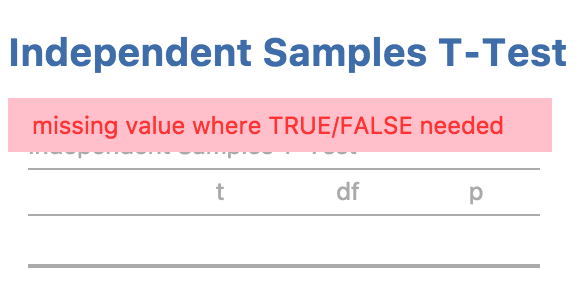
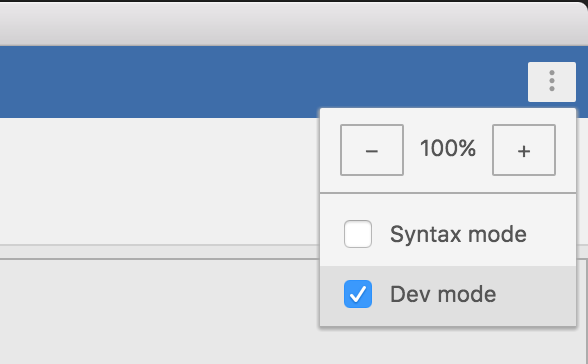
In this example, our code is only one line of code, so we can be reasonably confident where the problem lies. However, in practice software can be two or three or even more lines of code. In more complex situations, it can be handy to have a ‘stack trace’ which tells us where the problem occurred. jamovi can be placed in ‘dev mode’, which displays stack traces when errors occur. dev mode can be toggled from the app menu to the top right of the jamovi window:
With dev mode turned on, we can see the stack trace and see that the
call to t.test(c(Inf, 3)) is responsible for the error.
When developing jamovi modules, it’s best to just leave dev mode on.
Next: Creating Rich Results