Responsive Image Sizing
When a user resizes a plot in jamovi, they expect it to behave intelligently. A simple “stretch-to-fit” approach often fails because certain elements—like axis labels, margins, and legends—should remain a constant size, while the data area should expand or contract.
To create a truly “native” feel, you need to define how your image responds to resizing.
The Mental Model: Fixed vs. Stretchable
To create plots that scale intelligently, you must distinguish between space that must stay constant and space that should expand.
- Fixed Area (B for “Base”): Elements that don’t change size when the plot is resized. This includes axis titles, tick labels, and margins.
- Stretchable Area (M for “Multiplier”): The actual data-carrying part of the plot (e.g., the facets, the plotting area).
Note
The Core Formula The relationship between these two is: Total Dimension = M + B
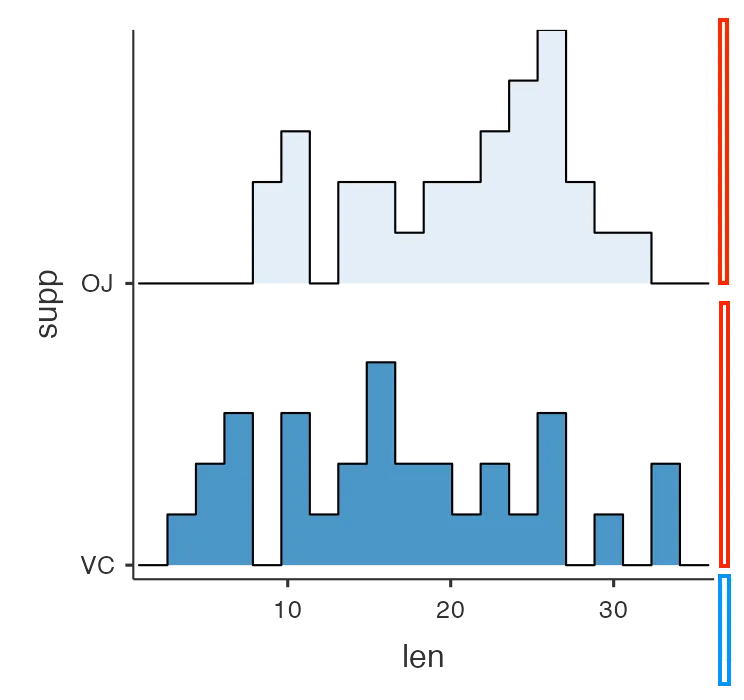
In the image above:
- The blue areas are Fixed. They take up the same number of pixels regardless of the total image size.
- The red areas are Stretchable. They expand or contract to fill the available space.
The Problem with Simple Scaling
Imagine a plot with 2 rows of facets. You’ve set it to look perfect at 600px height. If the user adds a third row, jamovi needs to know how much to increase the height to keep the facets looking the same.
If you just scale the whole image by 50%, the axis labels and margins also grow by 50%, which looks “off.”
The Solution: setSize2
The setSize2 method allows you to specify exactly how much of your plot is stretchable and how much is fixed.
self$results$plot$setSize2(widthM, heightM, widthB, heightB) # widthM, heightM, widthB, heightB- widthM / heightM: The “Multiplier” or stretchable dimensions.
- widthB / heightB: The “Base” or fixed dimensions.
Example: Faceted Plots
Suppose you have a plot where each row of facets should be 250px tall, and your axes/margins take up 100px.
Calculate your dimensions based on the number of rows:
nRows <- length(unique(self$data[[self$options$group]]))
heightM <- 250 * nRows
heightB <- 100

self$results$plot$setSize2(500, heightM, 100, heightB) # widthM, heightM, widthB, heightB
Now, when the user resizes the plot, jamovi calculates a scale factor based only on the stretchable area, preserving the proportions of your facets while keeping the axes crisp.
Implementation
Follow these steps to implement responsive sizing in your analysis:
1. Identify Fixed Dimensions
Determine the approximate pixel height of your X-axis and the width of your Y-axis. Usually, 100px is a good starting point for a standard plot.
2. Define the Stretchable Unit
Decide how many pixels a single “unit” (like a facet or a category) should occupy.
3. Apply setSize2
Call the method in your .run() function.
Important
Backward Compatibility
The setSize2 method was introduced in jamovi 2.7.16. To ensure your module works on older versions, always use a guard clause.
# ✅ BEST PRACTICE
image <- self$results$plot

if ( ! is.null(image[["setSize2"]])) {
    # New jamovi: Use responsive sizing
    image$setSize2(500, 250 * nRows, 100, 100) # widthM, heightM, widthB, heightB
} else {
    # Old jamovi: Fallback to fixed sizing
    image$setSize(600, 250 * nRows + 100)
}
Summary Checklist
- Did I use a guard clause? Ensure compatibility with older jamovi versions.
- Is my math dynamic? Base your
heightMorwidthMon the number of variables or groups selected. - Did I account for both axes? Remember that both width and height usually have fixed components.
Next Step: Once your analysis is visual and responsive, it’s time to ensure it is robust with Unit Testing.