Creating Rich Results
In this section, we are going to transform our raw text output into a nice, professional, APA-formatted table.
1. Upgrading the Results Definition (.r.yaml)
If you open jamovi/ttest.r.yaml right now, you’ll see the boilerplate text element that jmvtools automatically generated for us earlier:
items:
    - name:  text
      title: Independent Samples T-Test
type: Preformatted- type: Preformatted: This is a simple container for raw text output. We’ve been using this so far with
setContent()to dump our raw R findings.
To provide rich results, we are going to add a new structured Table container. Modify your ttest.r.yaml to add the ttest table underneath the existing text item:
---
name:  ttest
title: Independent Samples T-Test
jrs:   '1.1' # jamovi results spec

items:
    - name:  text
      title: Independent Samples T-Test
      type:  Preformatted
    - name:  ttest
      title: Independent Samples T-Test
      type: Table
      rows:  1
      columns:
        - name: var
          title: ''
          type: text
        - name: t
          type: number
        - name: df
          type: integer
        - name: p
          type: number
          format: zto,pvalue
...- type: Table: Reserves space for a structured table.
- format: zto,pvalue:
zto(zero-to-one) is for values that fall in the 0 -> 1 range, andpvalueis for p-values. These format codes instruct jamovi how to format these values (i.e. if the value is very small, it might be rendered< .001).
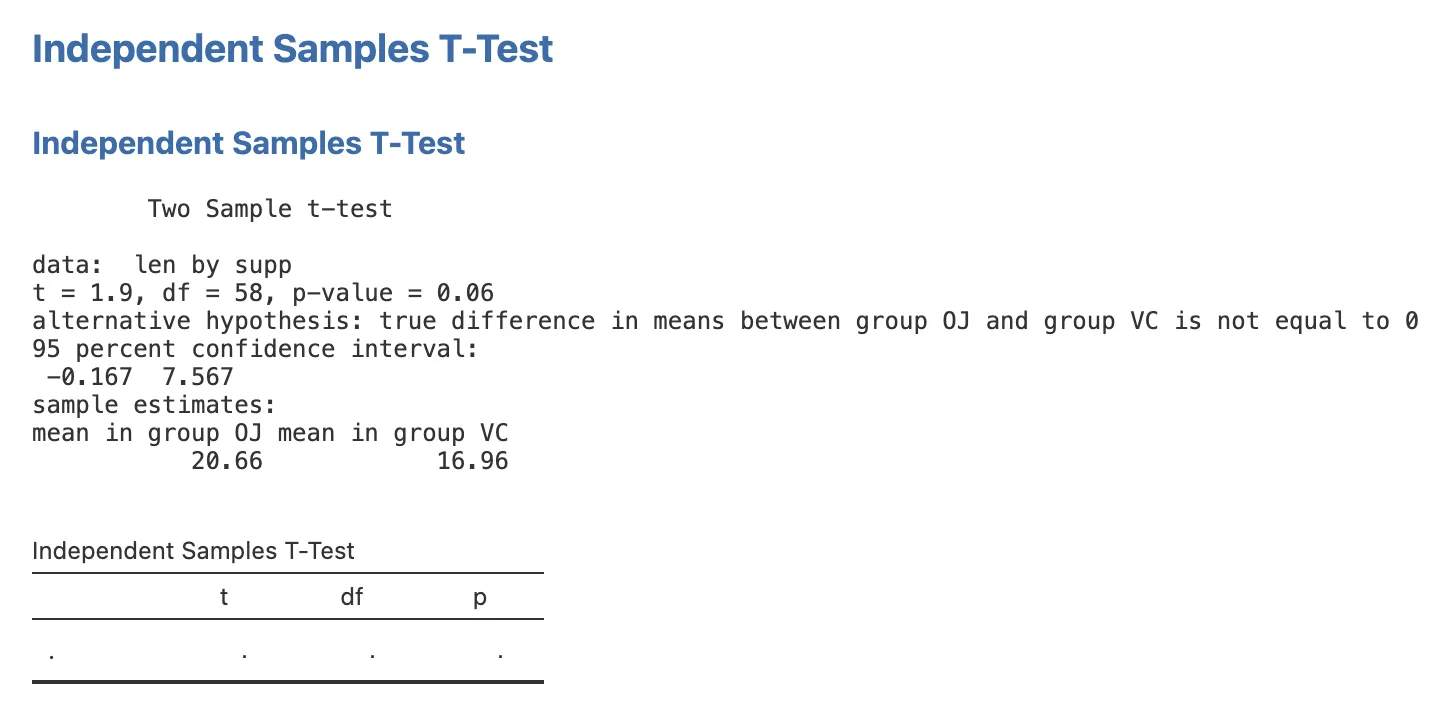
If you reinstall your module right now (jmvtools::install()), jamovi reads your results definition and generates the new table UI below your existing text output. However, because our R code isn’t filling the table yet, it will be completely blank:
2. Populating the Table
Now we need to update our construction crew in R/ttest.b.R to extract values from the R t-test object and “pour” them into the new table.
Update your .run() function to match the complete implementation below. Notice how we are leaving the old self$results$text$setContent(results) line exactly where it is for now:
Note
Handling R Objects
R functions return different types of objects (S3, S4, or Lists), and extracting the values you need often takes a little trial and error. Here are the most useful tools for introspecting an object in your R console:
| Function | What it tells you |
|---|---|
class(results) | The object type (e.g. htest, lm, list) |
names(results) | The named fields you can access with $ |
str(results) | A compact overview of the full structure and types |
results$statistic | Access a named field directly with $ |
A typical workflow: run your analysis interactively in the R console, call str(results) to see what’s inside, then use $ or [[ to drill down to the exact value you need.
.run=function() {
# 1. Input Check: Stop quietly if inputs are missing
if (length(self$options$dep) == 0 || length(self$options$group) == 0) {
return()
}
# 2. Construct the formula (e.g., "len ~ supp")
formula <- jmvcore::constructFormula(self$options$dep, self$options$group)
formula <- as.formula(formula)
# 3. Run the analysis (using the stats namespace)
results <- stats::t.test(formula, self$data, var.equal=self$options$varEq)
# 4. Populate the results panel
self$results$text$setContent(results)
# 5. Access the table object
table <- self$results$ttest
# 6. Fill in the row
table$setRow(rowNo=1, values=list(
var = self$options$dep,
t = results$statistic,
df = results$parameter,
p = results$p.value
))
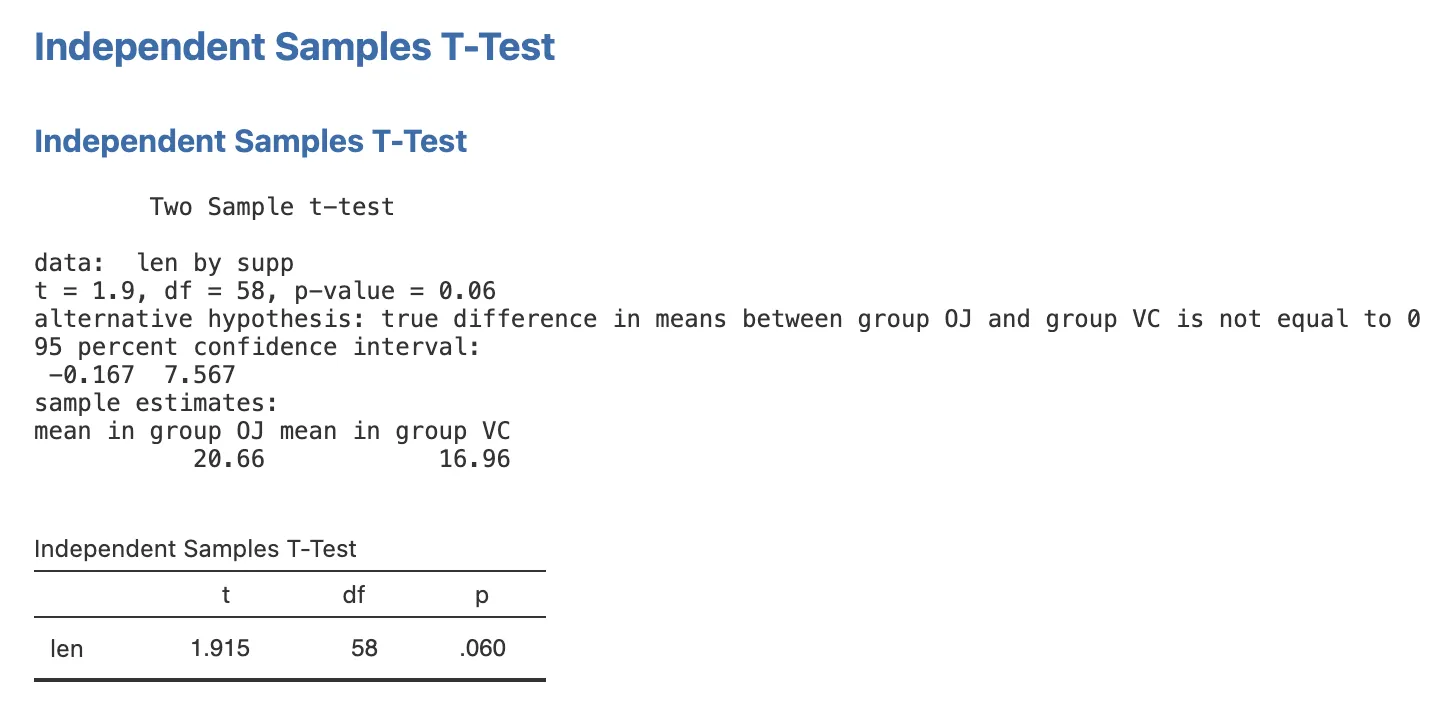
}Now, reinstall your module with jmvtools::install(). Thanks to the new logic, your beautiful, formatted table is seamlessly populated in jamovi right below your raw text:
3. Cleaning Up
We successfully built our rich table! Now we don’t need that ugly raw text output cluttering the screen anymore.
As a final cleanup step:
- Go back to
ttest.r.yamland delete the entiretextitem. - Open
ttest.b.Rand delete the obsoleteself$results$text$setContent(results)line.
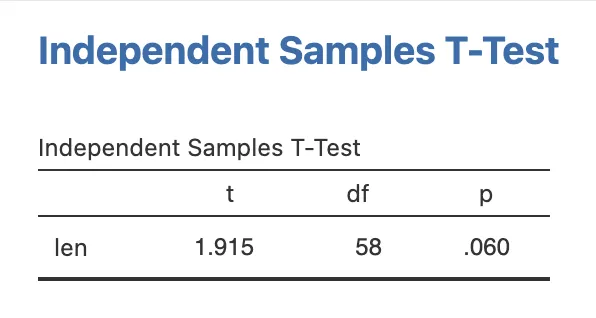
If you reinstall your module one last time, you’ll have a pristine, professional results panel:
Next Step: Now that your analysis produces rich results, let’s build the visual centerpiece by Adding Plots.