Plot Modules
A plot module is a module that appears under the Plots tab in jamovi rather than the Analyses tab. The technical change is small — a single category: plots field — but the editorial expectation is significant: the Plots tab is reserved for modules whose primary purpose is producing a plot.
Important
Before reaching for category: plots, read the next section. Putting a non-plotting module in the Plots tab makes the tab harder to navigate for end users, and is the most common reason a plot module is rejected from the jamovi library.
Should Your Module Be a Plot Module?
A module belongs in the Plots tab only if its primary output is a plot.
Use a plot module when:
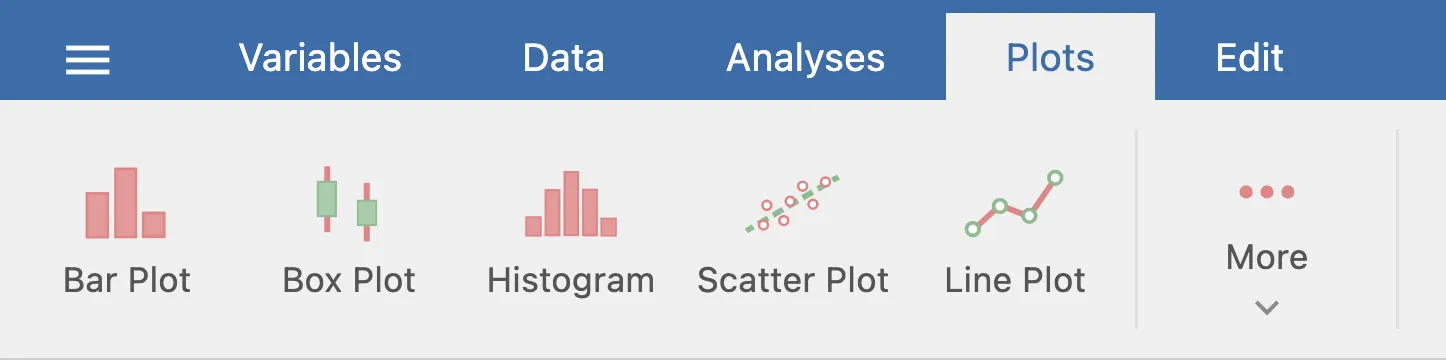
- The user opens the module specifically to see a visualization (scatter plot, histogram, bar chart).
- Any tables or text in the results are supporting context (axis info, group summaries, captions) — not the main payload.
- A reasonable user would describe the module as “a plot”, not “an analysis that includes a plot”.
Do not use a plot module when:
- The module computes a statistical test or model and happens to include a plot among its outputs.
- The interpretation or numerical results are the headline; the plot is illustrative.
- The module would feel out of place sitting next to Scatter Plot and Histogram in a list of plots.
When in doubt, ship it as a regular analysis module. Plot modules can still return tables and text — the constraint isn’t technical, it’s about user intent. If the user is going to the Plots tab to find your module, it’s a plot module.
Registering a Plot Module
Set category: plots in two places.
1. Module level — jamovi/0000.yaml
---
name: myplots
title: My Plots
version: 1.0.0
jms: '1.0'
category: plots
authors:
  - Your Name
description: >-
  A collection of plots built on ggplot2.
2. Per analysis — each .a.yaml
---
name:  scatter
title: Scatter Plot
category: plots
menuGroup: .
version: '1.0.0'
jas: '1.2'
The special value menuGroup: . places the analysis at the root of the Plots tab. Use a named subgroup (e.g., menuGroup: More) to nest plots under a subheading.
Reference Implementation
jamovi/jmvplots — the plots bundled with jamovi — is the reference plot module. Study its .a.yaml files to see category: plots and menuGroup in context.