Building Your First Analysis
In this section, we will create a jamovi module from scratch and add an Independent Samples T-Test. This builds on the environment we set up in the Getting Started guide.
1. Scaffold the Module
The easiest way to create a module is with the create() function. Open your R console and run:
jmvtools::create('SuperAwesome')This command creates a new directory called SuperAwesome in your source tree (your project’s file structure). If you open the folder, you will find:
SuperAwesome/
├── DESCRIPTION          # Standard R package metadata
├── NAMESPACE            # Standard R package namespace
├── jamovi/              # jamovi-specific configuration (The "Manifest")
│   └── 0000.yaml
└── R/                   # R source code directory
Tip
The “Dual Citizen” Concept:
jamovi modules are standard R packages. This means they can be built, installed, and used in an R session like any other library, but the jamovi/ directory contains the “Dual Citizenship” papers that allow them to run inside the jamovi application.
2. Add an Analysis
To add an analysis template to your module, use addAnalysis(). Ensure your working directory is set to the SuperAwesome folder first:
setwd('SuperAwesome')
jmvtools::addAnalysis(name='ttest', title='Independent Samples T-Test')
This updates your module’s directory structure to the following:
SuperAwesome/
├── DESCRIPTION
├── NAMESPACE
├── jamovi/
│   ├── 0000.yaml
│   ├── ttest.a.yaml       # Analysis definition
│   ├── ttest.r.yaml       # Results definition
│   └── ttest.u.yaml       # UI definition
└── R/
    ├── ttest.h.R          # Header (auto-generated)
    └── ttest.b.R          # Analysis implementation
3. The 5-File Structure
These five new files each play a distinct role. While it may seem like a lot, this separation of concerns makes your code easier to maintain:
| File | Type | Purpose |
|---|---|---|
ttest.a.yaml | Analysis Definition | Contains all the meta information about the analysis: describes the options that the analysis uses, so they can be presented in the UI. |
ttest.r.yaml | Results Definition | Contains all the information about how the results are displayed (tables, plots, etc.). |
ttest.u.yaml | UI Definition | Describes how the analysis options should be presented to the user; i.e. checkboxes, list boxes, etc. (For beginners, this is automatically generated from the .a.yaml file.) |
ttest.h.R | Header | Automatically generated from the .a.yaml and .r.yaml files. Makes writing your analysis much easier. You don’t need to look at this file, and you should never edit it. |
ttest.b.R | Analysis Implementation | Where you’ll write your R code. You’ll spend most of your time here when developing a jamovi analysis. |
4. The Analysis Definition (.a.yaml)
Open jamovi/ttest.a.yaml. This file uses YAML, a human-readable format for structured data.
Important
YAML Rule #1: Indentation matters! Always use spaces (not tabs) for nesting items. Most modern IDEs and editors will do this for you automatically, but if you’re using something old-school, you’ll need to make sure it’s using spaces.
---
name: ttest
title: Independent Samples T-Test
jas: "1.2" # jamovi analysis spec (tells jamovi which API version to use)
version: "1.0.0"
options:
- name: data
type: Data
- name: dep
title: Dependent Variable
type: Variable
- name: group
title: Grouping Variable
type: Variable
- name: alt
title: Hypothesis
type: List
options:
- name: notEqual
title: Not equal
- name: greater
title: Greater
- name: less
title: Less
default: notEqual
- name: varEq
title: Assume equal variances
type: Bool
default: true
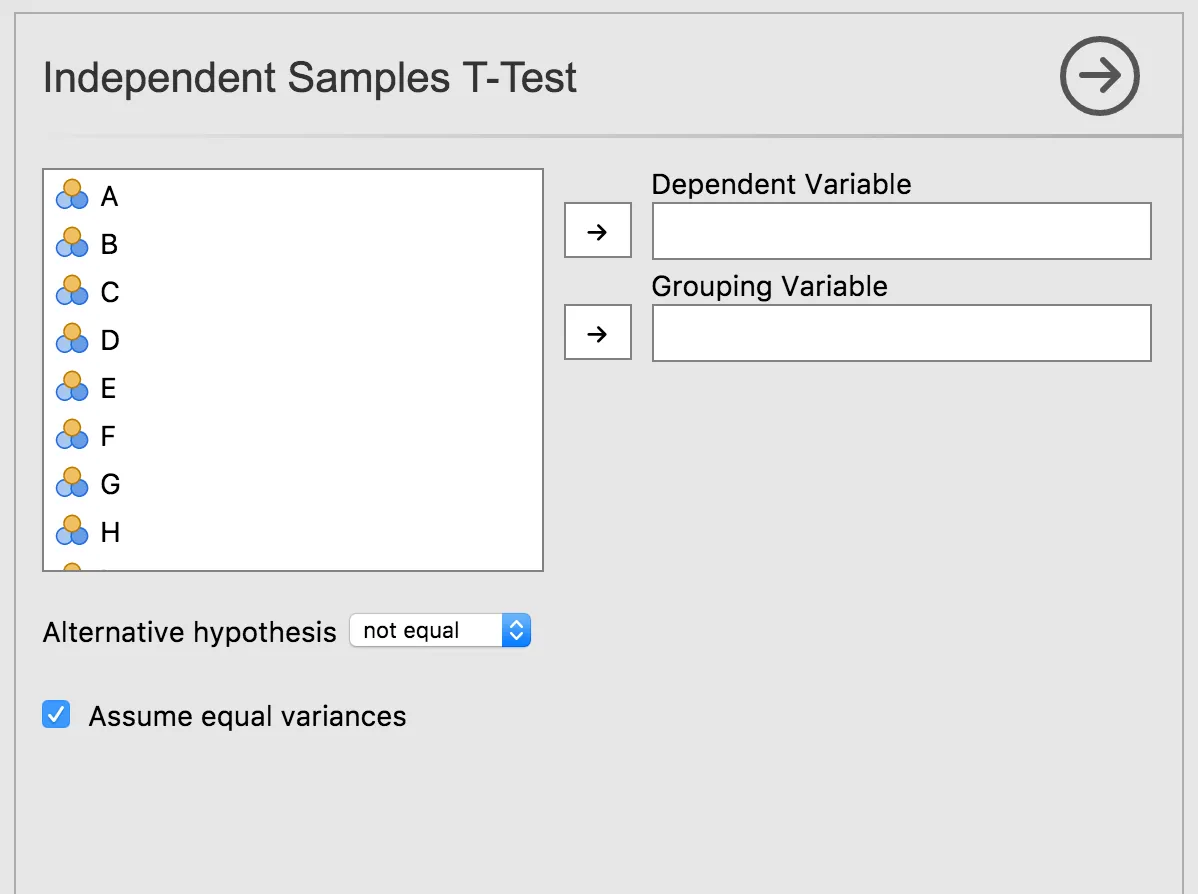
...Mapping YAML to the UI
- Variable: Creates a “drop target” for data columns.
- List: Creates a dropdown menu for options.
- Bool: Creates a checkbox.
5. Verify the UI
Install the module to see your new menu in jamovi:
jmvtools::install()In jamovi, you will now see the SuperAwesome menu with your Independent Samples T-Test:
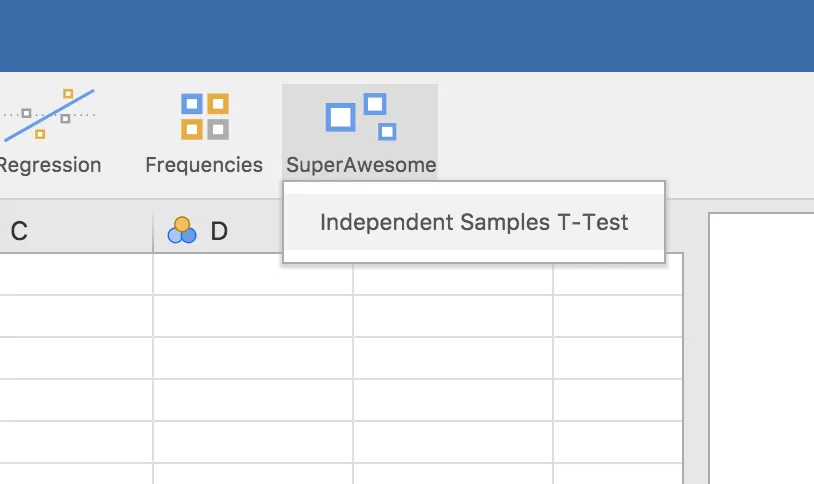
Next Step: Your analysis has a beautiful (?) UI, but it doesn’t perform any calculations yet. Let’s implement the R logic.