Implementing an Analysis
In this section, we will add the R code to perform our t-test calculations. This builds on the UI we created in the previous section.
1. Locate the Implementation File
In jamovi, the analysis logic lives in the .b.R file. Open R/ttest.b.R in your editor. You will see a generated template:
ttestClass <- R6::R6Class(
    "ttestClass",
    inherit = ttestBase,
    private = list(
        .run = function() {
            # Your code goes here
        })
)
Note
What is R6?
jamovi uses the R6 object-oriented system. Instead of writing simple functions, we write a Class.
- inherit = ttestBase: Inherits the core plumbing from jamovi.
- private = list(.run = …): This is where you put your code.
- self: Use this keyword to access the analysis’ data, options, and results (e.g.,
self$options).
2. Writing the Logic
Let’s implement the t-test. We’ll start by calling the standard R t.test() function. Note that we access it using the full namespace (stats::t.test) instead of just typing t.test(). This guarantees R runs the core version without naming collisions and speeds up the module by skipping search path lookups.
Never use library()!
ttestClass <- R6::R6Class("ttestClass",
    inherit=ttestBase,
    private=list(
        .run=function() {
            # 1. Construct the formula (e.g., "len ~ supp")
            formula <- jmvcore::constructFormula(self$options$dep, self$options$group)
            formula <- as.formula(formula)

            # 2. Run the analysis (using the stats namespace)
            results <- stats::t.test(formula, self$data, var.equal=self$options$varEq)

            # 3. Populate the results panel
            self$results$text$setContent(results)
        })
)
Understanding the Code
- Construct the formula: We use
jmvcore::constructFormulainstead ofpaste(). It automatically handles column names with spaces (e.g.,"the fish") by adding backticks, preventing your analysis from crashing. - Run the analysis: We pass the formula and data to the robust
stats::t.test(). - Populate the results: When you ran
jmvtools::addAnalysis()in the previous tutorial, it automatically generated a boilerplatettest.r.yamlfile containing a single Preformatted Text result element namedtext. We useself$results$text$setContent(results)to safely inject our raw R output into that result container in the jamovi UI.
3. Install and Test
Install the updated module:
jmvtools::install()Test in jamovi
- Go to ☰ -> Open -> Data Library -> Tooth Growth.
- Select SuperAwesome -> Independent Samples T-Test.
- Assign
lento Dependent Variable andsuppto Grouping Variable.
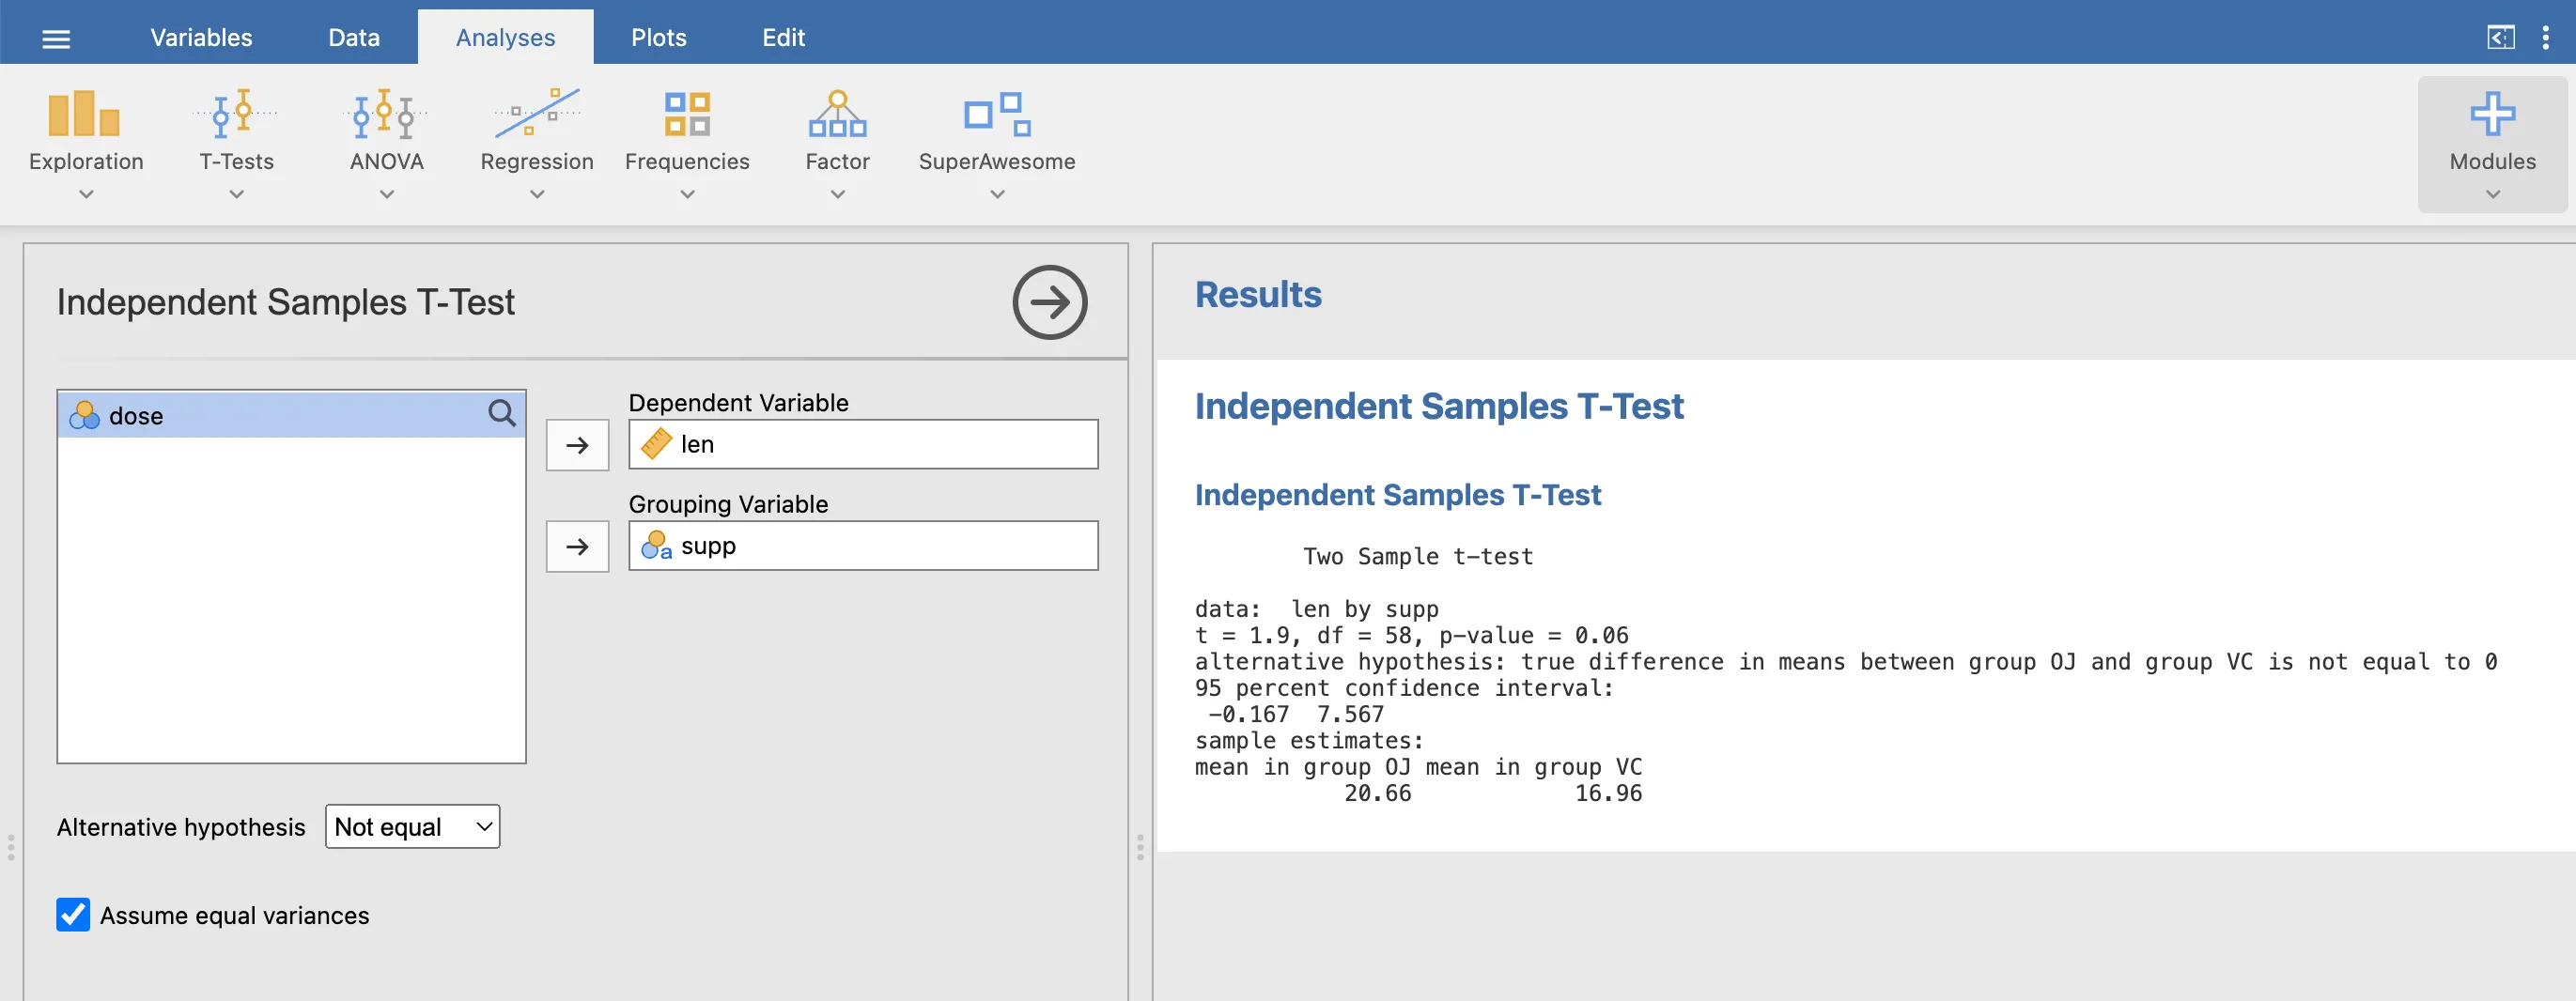
Results in jamovi
Test in R
Since jamovi modules are R packages, you can test them in your R console using devtools:
# If you don't have devtools installed, uncomment the line below:
# install.packages('devtools')
# Install for the R console
devtools::install()
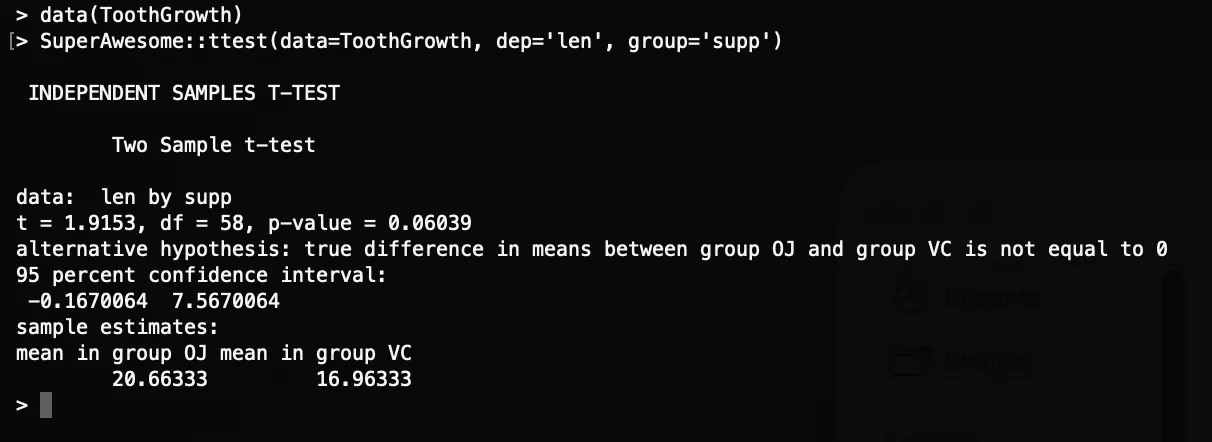
data(ToothGrowth)
SuperAwesome::ttest(data=ToothGrowth, dep='len', group='supp')Results in R
Next Step: The raw text output works, but before we build richer results, let’s protect it from crashing on empty inputs: Input Checks.